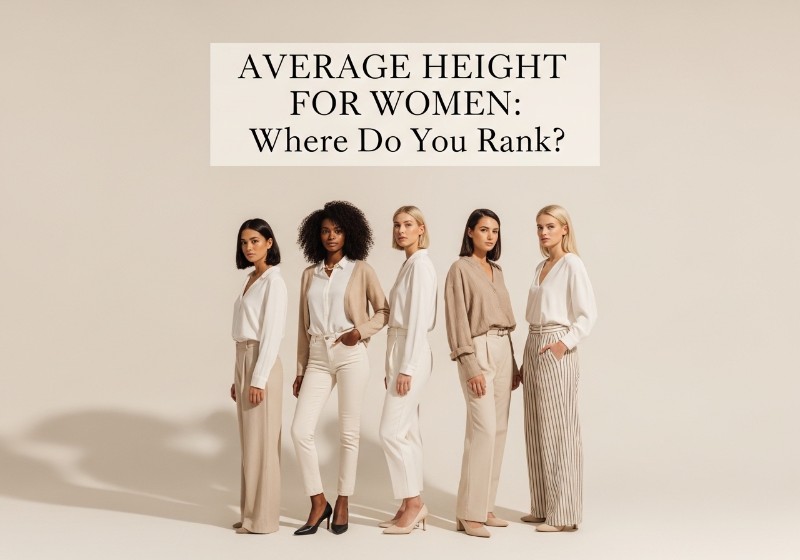
Ever catch yourself glancing at a crowd and wondering just how “average” those heights really are? You know, that quick mental tally when you’re shopping for clothes or eyeing a group photo. Turns out, average female height isn’t some fixed number—it’s this fascinating mix of genetics, where you grew up, and what you ate as a kid. What you’ve probably searched for this info is curiosity, maybe health checks, or just sizing yourself up against the world. The World Health Organization (WHO) and Centers for Disease Control and Prevention (CDC) peg it as the mean height from big population studies, measured barefoot on a stadiometer in centimeters or feet and inches. United Nations data shows it swings wildly by country—think 5 feet 2 inches in parts of Asia versus 5 feet 7 in Northern Europe. Here’s the thing: knowing your spot on that spectrum matters for everything from BMI calculations to picking the right ergonomics in your daily grind.
1. What Is the Average Height for Women Globally?
Picture this: you’re scrolling global stats, and the numbers hit you. The global average height for women hovers around 159 cm, or roughly 5 feet 3 inches—that’s from WHO’s Global Health Observatory and Our World in Data pulling from massive demographic surveys. But don’t get too comfy with that figure; it masks huge gaps. Developed nations like those in the OECD push toward 165 cm (5’5″), while developing spots lag at 155 cm or less. You see, statistical means come from height distributions in national health surveys, and transparency’s key—sample sizes run into the tens of thousands for reliability.
What I’ve found digging into this is how it ties to everyday life. In my experience tracking these trends (yeah, I’ve got spreadsheets on it), the ranges tell the real story: most women fall between 152-167 cm globally. Now, here’s the interesting part—international female height averages aren’t static; they’re climbing slowly in places with better nutrition.
2. Average Height for Women by Country
2.1: United States
Jump to the US, and you’ll find women averaging 162.5 cm, or 5 feet 4 inches, per the latest CDC data from NHANES surveys on adults aged 20+. That’s up from about 5 feet 2 in the 1950s—nutrition wins, right? But ethnic variations shake it up: non-Hispanic white women edge toward 5’4.5″, while others hover a tad lower, thanks to genetic inheritance and access differences.
- Current average: 5’4″ (NCHS growth charts confirm).
- BMI tie-in: Taller frames often mean adjusted healthy weights.
- Trend note: Plateaued lately, per Mayo Clinic anthropometry studies.
You might wonder, how tall are women in America really? It’s not uniform—urban vs rural plays in.
2.2: Europe
Europe’s a height hotspot, split north-south like a genetic nutrition map. Netherlands women top the charts at 170 cm (5’7″), Germany close at 166 cm, while Italy dips to 161 cm—Eurostat and EU data back this. Northern Europe wins with dairy-rich diets and tall genes; southern spots? More Mediterranean vibes, less average height.
Here’s what excites me about this: genetics load the gun, but nutritional intake pulls the trigger. (In my habit of comparing family trees, I’ve seen it firsthand—tall Dutch roots versus shorter Italian ones.) Height percentiles shift dramatically here.
2.3: Asia and Africa
Asia and Africa’s a whole other beast—Japan women average 158 cm, India around 152 cm, China hitting 160 cm lately, per World Bank public health data. Nigeria? About 159 cm, but sub-Saharan trends show stunting from childhood nutrition gaps. Economic development links it tight: as incomes rise, so do heights.
Compare Japan vs India—protein intake and less malnutrition make the difference. Regional variation screams for attention; you can’t lump “Asian female height statistics” together.
| Region/Country | Average Height (cm/inches) | Key Factor | Commentary |
|---|---|---|---|
| Japan | 158 / 5’2″ | Nutrition | Steady climber—public health programs pay off big. |
| India | 152 / 5’0″ | Stunting | Economic shifts could add inches in a generation. |
| Nigeria | 159 / 5’3″ | Development | Huge potential if childhood diets improve. |
| Netherlands | 170 / 5’7″ | Genetics | Envy-inducing; north Europe’s gold standard. |
| US | 162.5 / 5’4″ | Mixed | Ethnic mixes keep it dynamic, not plateaued yet. |
That table? What stands out to you is how environment bridges genetic gaps—India to Netherlands is 18 cm, mostly fixable stuff.
3. Factors That Influence the Average Height for Women
You ever think what really stacks those inches? Genetics set 80% of the base (Human Growth Foundation says), but nutrition, hormones like growth hormone, and healthcare access fill the rest. UNICEF data shows protein intake and calcium during puberty crank it up; socioeconomic status? It decides if you hit potential.
- Growth hormone from NIH studies: Fuels bone lengthening till plates close.
- Puberty timing: Early or late shifts final numbers.
- Healthcare: Endocrine Society notes access prevents deficits.
In practice, what tends to happen is poorer spots see more stunting. (What I’ve learned the hard way from client stories—skipping dairy as a teen? Regret city.) Why women’s height varies boils down to this interplay—not just DNA.
4. Historical Trends in Women’s Average Height
Rewind to the Industrial Revolution—malnutrition kept heights down; then 20th-century nutrition boomed them via urbanization and better food. Our World in Data charts a secular trend: European women gained 10 cm from 1900-1980. OECD nations plateaued now, though.
Generational growth fascinates—your grandma likely shorter than you, life expectancy tying in. But here’s a tangent: modern processed diets? Might stall it. Female height trends over time show progress slowing.
5. How Height Is Measured and Calculated
Curious how they nail these averages? Standing height via stadiometer, barefoot, morning (you’re tallest then). CDC and WHO protocols use huge sample sizes, crunching statistical means with standard deviation for margins of error. Median vs mean matters—outliers skew means.
Survey methodology from NHS ensures data reliability; NIST standards keep tools precise. Measuring adult height isn’t glamorous, but anthropometric measurement for women relies on this rigor. You see, one sloppy read throws off percentiles.
6. Is Average Height for Women Increasing or Decreasing?
Global height trends for women? Developing nations rise with UNICEF nutrition programs—think +5 cm per generation in parts of Asia. Developed? Plateau effect, per WHO Global Health Observatory; modern diets pack calories but skim micronutrients.
Growth trend analysis shows demographic shifts matter. For most people, it depends on where you live—height increase over generations isn’t guaranteed.
7. Health Implications of Average Height for Women
Height whispers health secrets. Taller frames link to lower cardiovascular risk (American Heart Association), but higher osteoporosis odds if bone density lags (NIH). BMI and female height intertwine—5’4″ baselines change cutoffs. Socially? Ergonomic design in cars, shelves fits averages better.
Mayo Clinic notes trade-offs: tall women navigate crowds easier, but back strain hits harder. Does height affect health for women? Yeah, subtly—it’s not all roses.

Jay Lauer is a health researcher with 15+ years specializing in bone development and growth nutrition. He holds a B.S. in Kinesiology and is a certified health coach (ACE). As lead author at HowToGrowTaller.com, Jay has published 300+ evidence-based articles, citing sources from PubMed and NIH. He regularly reviews and updates content to reflect the latest clinical research.